Documentation
(By Andreas Plank from 5th May 2008, last modified 19th March 2019)
Introduction
This is inteded to be a short description of CHIP: Chironomidae Interactive Program. It can be used for larvae, pupae and adults of chironomids and is an interactive, dynamic, web-based determination key independent of any operating system. Written in PHP and linked to a MySQL database one can use it on any (local) computer and access to internet optionally. Features:
- organise, include and measure images (e.g. measure distances for ratios)
- include, manage references, cite literature
- create formatted text, sections and sortable tables with e.g. chironomid character data and
- creating distribution maps
- organising taxa is possible on genus level and species level.
This program uses the free software from http://www.apachefriends.org project. After installing this basic software users can use the determination program either with internet connection or without.
To guarantee only a non-profit usage it is licensed under: Creative Commons Attribution-Noncommercial-Share Alike 3.0 Unported (see http://creativecommons.org/licenses/by-nc-sa/3.0/). That means the user is free:
- to Share — to copy, distribute and transmit the work
- to Remix — to adapt the work. Under the following conditions:
- Attribution. You must attribute the work in the manner specified by the author or licensor (but not in any way that suggests that they endorse you or your use of the work).
- Noncommercial. You may not use this work for commercial purposes.
- Share Alike. If you alter, transform, or build upon this work, you may distribute the resulting work only under the same or similar license to this one.
Features
General Page Structure
In general there are several ways to determine specimens, edit/mange text + images and data within the program:
- most important: menu above
- MySQL database - menu to database
- Home – first site: version info
- References – all references
- Morphology – explained morphology
- Documentation – install, structure, FAQ, ...
- Upload pictures – upload manger for images (writes cited reference name into the image, i.e. it can only be inserted if there is a reference)
- Manage Names – manager to handle synonyms/names
- select menu to show a particular subfamily or a genus (i.e. identification)
Each genus is represented on a separate local web site that can be modified by the user with a popup text area interface with menu aside (described below). The edit pencil anywhere indicates somthing editable. For instance at sections »Notes«, »Ecology« or while managing synonym names or whatever.
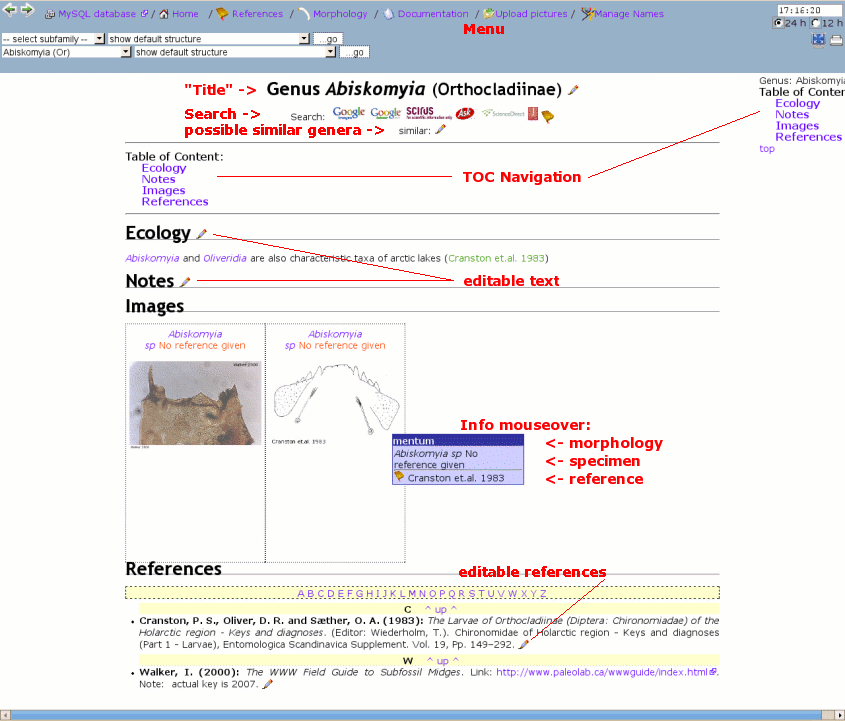
General site structure of CHIP
With a JavaScript library from Matt Kruse it is also possible to use filtering in tables. This is done by just using CSS classes as declaration in table headers. Thereyby an auto selection list can be created or manually one can filter in input fields with a regular expression search, like for instance: 1.[5-9] for 1.5 to 1.9. This enables the user to create matrix tables to quickly find a taxon by setting filter criteria.
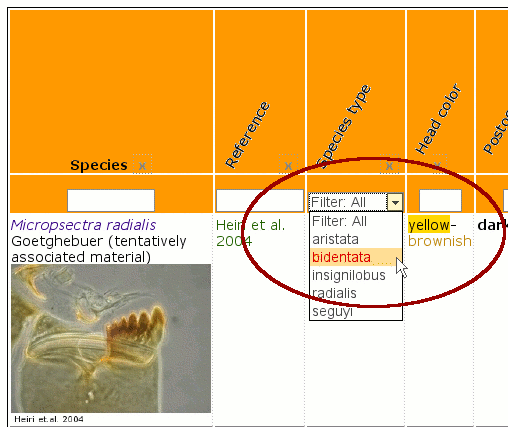
Filtering of tables
Measuring images can be done as well. For instance one can calculate then ratios like antennal ratio and so on. With this popup it's also possible to change attributes from an image, adding notes or correct morphological structure and license. All annotations can be seen then when the mouse moves over this image.
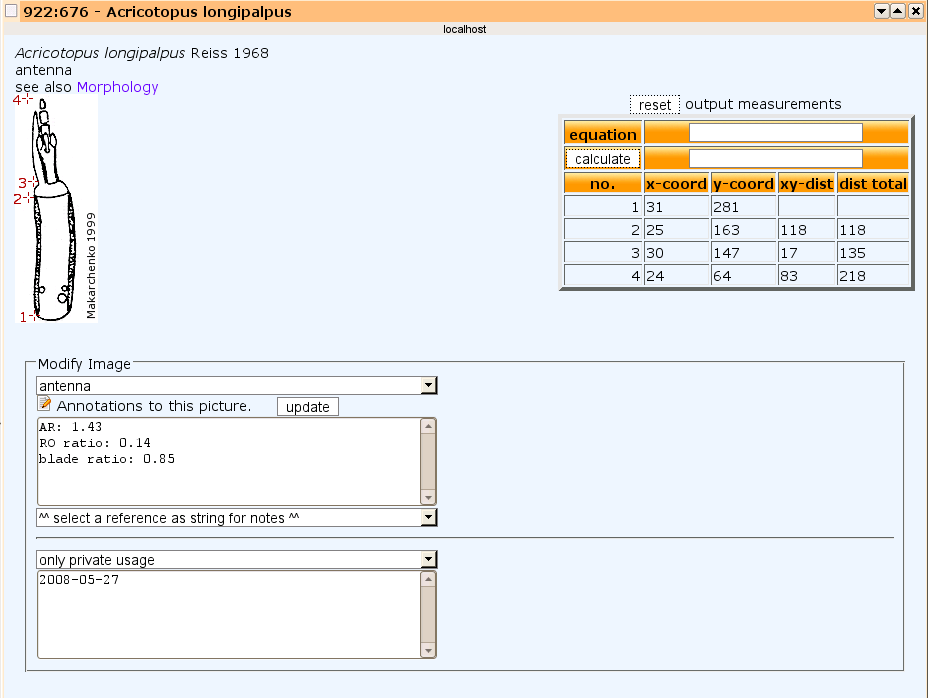
Popup to measure or annote image
Editing Pages: Notes and Ecology
Clicking on the edit pencil either at section »Ecology« to organise ecological data or clicking at »Notes«, the user can modify genus pages and add/delete content. A menu provides help to editing content for:
- sections, lists, tables
- citing references
- creating maps
- insert images from the database directly or with mouseover effect (e.g. to help explainig what "Pedicels as long as the lauterborn organ means" by moving mouse over the text)
Most input text-syntax follows wikipedia and is explained here and within program's documentation as well. A table of content is created automatically.
How to edit and write strucured content in detail, is given here in the table below:
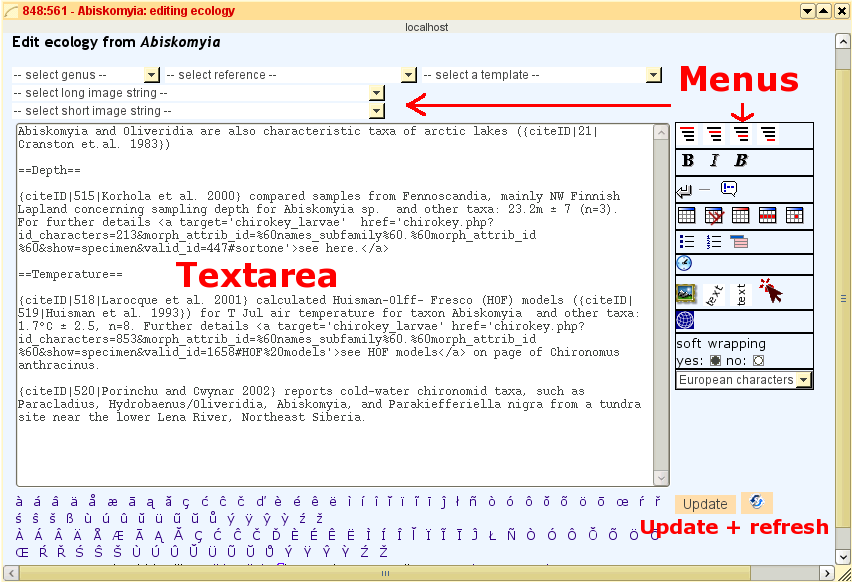
Edit notes and ecology contents
Determination
Following features help to determine a specimen on specimens level:
- use comparing mode if a specimen was clicked at last. In this mode all specimens that appear in "similar: ..." on the top of the genus page will be compared as well.
- creating a sortable table as described below that can be filled with numeric data (done already with difficult taxa like Cricotopus, Orthocladius, genera within Tanytarsini: Tanytarsus, Micropsectra ...)
- use openoffice database frontend (I had only time to insert numerical characters for most Cricotopus and Orthocladius specimen)
On genus level: select a subfamily in the menu
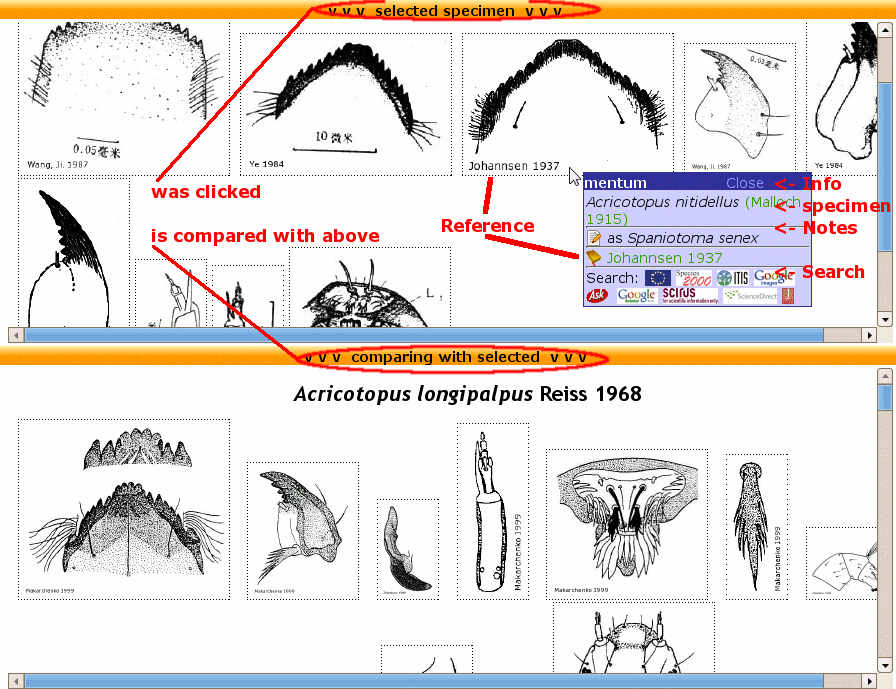
Comparing mode of CHIP
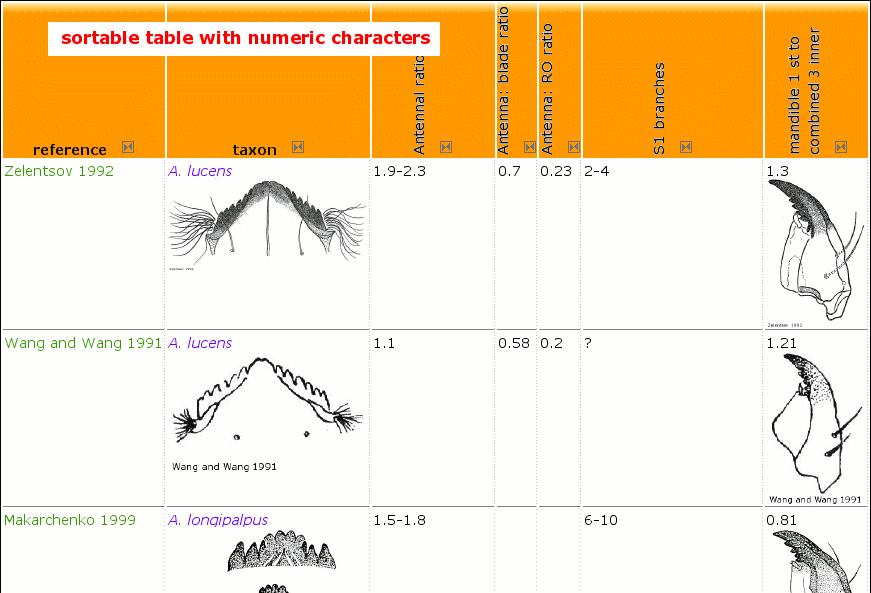
Make table sortable
| tag | syntax | example | ||||||||||||
|---|---|---|---|---|---|---|---|---|---|---|---|---|---|---|
| table | ||||||||||||||
| <table>...</table> | {| table content |} |
|||||||||||||
| <tr>...</tr> | |- |
|||||||||||||
| <th>...</th> | !| table head content !im| table head content as image |
|||||||||||||
| <td>...</td> | | table data content |
|||||||||||||
|
{| style='border-style:dashed;border-color:blue;border-width:2px;'
|- !|Reference !|entry !im|entry as image !im90|entry as image with 90 degrees |- |Pinder and Reiss 1983: |test |text |text |- |Heiri et.al. 2004: |further test |text |text |} |
|
|||||||||||||
| table with sorting | ||||||||||||||
| Note: if you have more than 1 entry as sortable table you have to give an individual id-attribute, e.g.. id='sorttwo' or something like that for the second table. | ||||||||||||||
|
{| style='border:1px solid;' class='sortable' id='sortone'
|- !|table head !im|table head as img !im90|table head as img + 90° |- |row1 t.data1 |t.data2 row1 |9 |- |row2 t.data1 |t.data2 row2 |3 |-class='sortbottom' |row3||sum||12 |} |
|
|||||||||||||
| font | ||||||||||||||
| <b>...</b> |
''bold''
|
bold | ||||||||||||
| <em>...</em> |
'''emphasis'''
|
emphasis | ||||||||||||
| <em><b>...</b></em> |
'''''bold emphasis'''''
|
bold emphasis | ||||||||||||
| links | ||||||||||||||
| <a href='url'>external link</a> |
[[http://de.wikipedia.org/wiki/Hauptseite Wikipedia]]
|
Wikipedia | ||||||||||||
| lists (max. 4 levels) | ||||||||||||||
| <ul> <li>unordered list</li></ul> |
*1<sup>st</sup> unordered list
**2<sup>nd</sup> unordered list ***3<sup>rd</sup> unordered list ****4<sup>th</sup> unordered list |
|
||||||||||||
| <ol> <li>ordered list</li></ol> |
#1<sup>st</sup> ordered list (numeric)
##2<sup>nd</sup> ordered list (alpha) ###3<sup>rd</sup> ordered list (ROMAN) ####4<sup>th</sup> ordered list (ALPHA) |
|
||||||||||||
| <dl> <dt>...</dt><dd>...</dd> </dl> |
;definition 1 : description 1...
;definition 2 : description 2... |
|
openlayer maps | |||||||||||
OpenLayers Map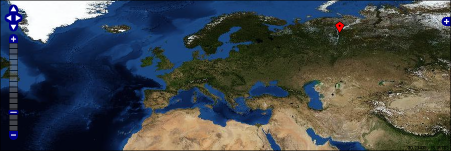 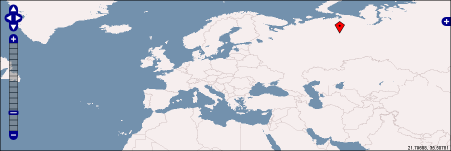
|
in general: {{openLayer|map-number| (lon$lat$heading$description) }} |
It's possible to use decimal coordiantes or in degrees-minutes-seconds (only complete in DMS, eg.: 30°0'0''). {{openLayer|1| means this is map number 1. So it should be possible to create multiple maps per page. Note, that coordiantes are enclosed with parentheses (...) and values are seperated by $-sign. If you want to draw only a dot, add as last argument (...$o). |
||||||||||||
| general substitutions | ||||||||||||||
|
<==
>== <= => <=> <- -> <-> 1st, 2nd... +- ~ |
≤
≥ ⇐ ⇒ ⇔ ← → ↔ 1st, 2nd... ± - non breaking space |
|||||||||||||
| special effects (Javascript class overlib) | ||||||||||||||
| Mouse over Image or Text |
{overlib|Mouse over Image or Text|<img align='middle' width=80 title='Paratanytarsus confusus (apex of antenna) Klink 1983' src='../../species/Pata_conf_aan_Kli1983_r.jpg' >}
|
Pedicels as long as the lauterborn organ | ||||||||||||
Editing: References
Inserting or editing references can be done by click on menu References › edit pencil. Now you can modify this reference. If you wish inserting a new one, just select option: »new reference (or select)« › »view« and insert required fields and save.
Abiskomyia and Oliveridia are also characteristic taxa of arctic lakes ({citeID|21|Cranston et.al. 1983})
References can be inserted in the popup textarea directly or indirectly:
- inserted text like: »Abiskomyia and Oliveridia are also characteristic taxa of arctic lakes (
{citeID|21|Cranston et.al. 1983})« produce this text with genus names highlighted and a reference entry at bottom's page. {nociteID|21|Cranston et.al. 1983}creates a reference entry but no citation in the text{numciteID|21|Cranston et.al. 1983}creates a numeric citation
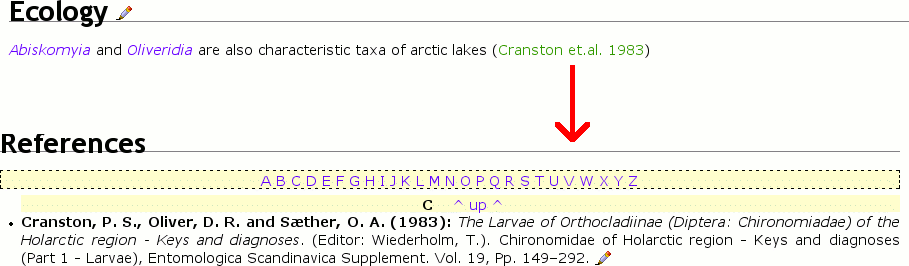
Cite literature and list them in references
Searching Facilities
Often one needs to search for several taxa. Either in taxon databases or getting literature on taxa. Automated highlighted taxa can be searched via google by clicking on the highlighted text. Another possibility is to use search icons at the top of the genus page or to click at icons on mouse over popups in comparing modus.
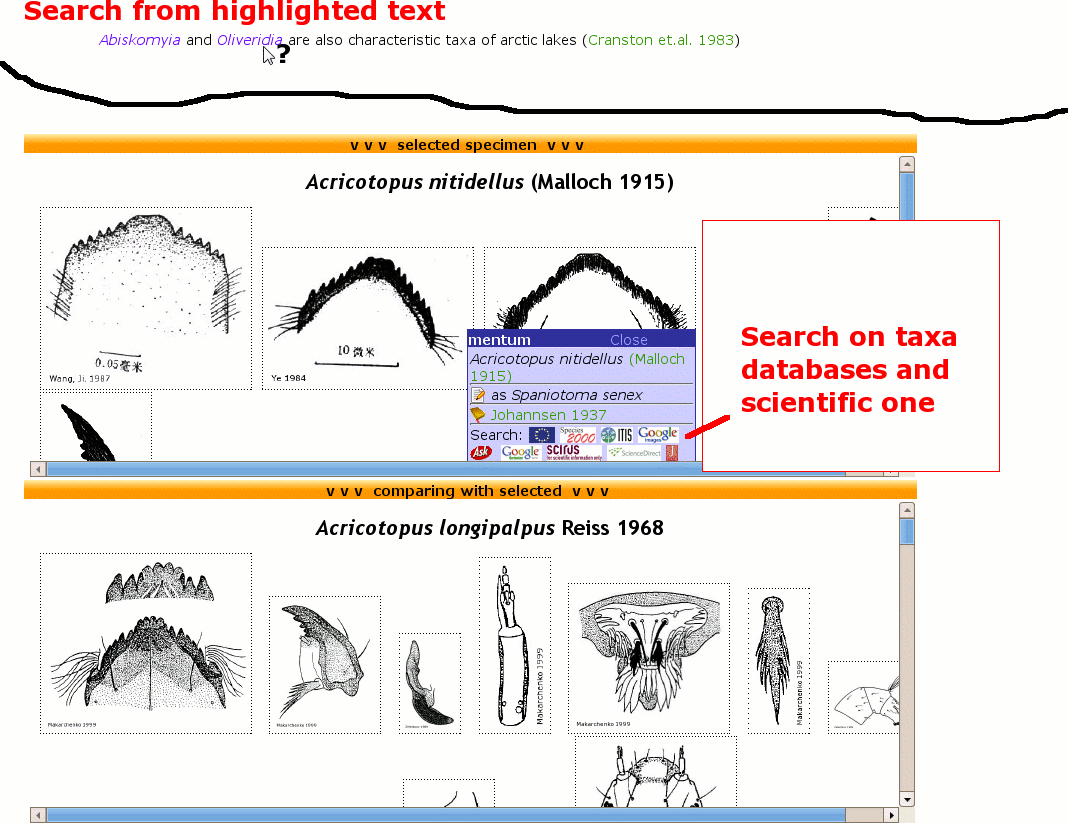
Image search during comparing mode
Outline Analysis
The determination key provides a tool to get outlines from images captured by a socalled chain code. This chain code is then analysed by normalized elliptic Fourier analysis, that is: its procedure tries to describe the ouitline by a given number of harmonics. In Fourier analysis a signal in time series is dissected in a determined number of amplitudes of cosine (cos) and sine (sin). Wheras in Elliptic Fourier analysis 'best' ellipses from large ones to small ones are used to describe outlines instead of amplitudes. The more harmonics (i.e. ellipses) the more detailed is the reconstructed outline. By using this approach one take advatage of having an equal number of landmarks, independence to size and rotation of the image and one is able to compare images by a subsequent shape analysis. For details concerning the Normalised Elliptic Fourier analysis see Kuhl and Giardina 1982 and program SHAPE at http://life.bio.sunysb.edu/morph/.
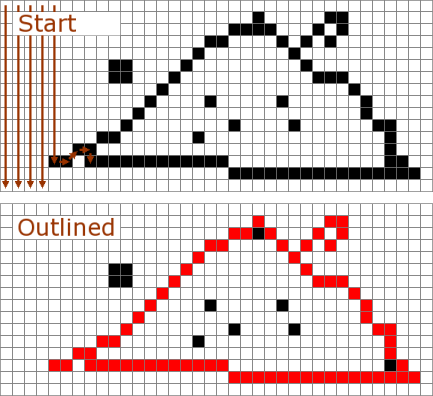
Procedure of detecting an outline by a given image
Download
You can download the latest version for free on the download section. This official version has full functionality but a limited number of images due to copyrights of other resources. A full image version is only for private usage and not downloadable.